Scenario card: ns3-urban-3.5ghz
Reference scenario of the comparison with ns-3 / 5G-LENA
Available since version 0.2.0. Use it as scenario: ns3-urban-3.5ghz in a configuration file or hl.builtin_scenario("ns3-urban-3.5ghz") in Python.
Purpose
An urban scenario that was also simulated with the packet-level simulator ns-3 and its 5G-LENA module: the 2 x 2-block TR 37.885 grid with seven sites (400 m apart here; the 200 m variant is part of the comparison), a 3.5 GHz carrier with 10 MHz, omnidirectional antennas, line of sight from the buildings only, shadowing drawn along each user's path, 20 vehicles at a constant 16 m/s on the street centre lines, one L1 sample every 200 ms and light traffic. The stored ns-3 results for 24 Event-A3 settings are the reference of handoverlab verify --ns3.
Layout
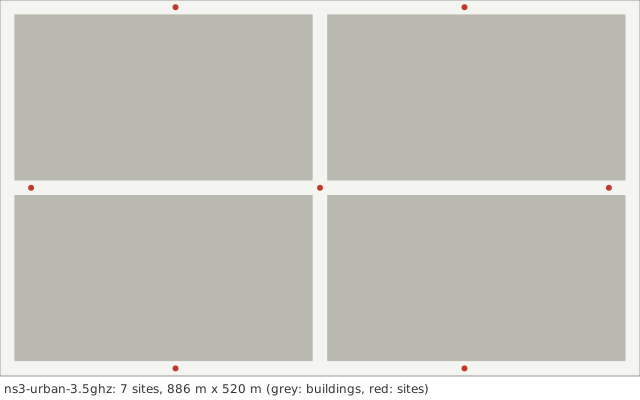
Seven sites at (0, 0), (+-400, 0), (+-200, +-250) m in the 2 x 2-block grid.
Parameters
Values in bold differ from the HandoverLab defaults.
| Key | Value | Source |
|---|---|---|
layout.kind |
street_grid | TR 37.885 Annex A (urban grid) |
layout.blocks |
[2, 2] | TR 37.885 Table A-1 (minimum 3 x 3 blocks) |
layout.pitch_m |
[433, 250] | TR 37.885 Annex A (433 m x 250 m) |
layout.street_width_m |
20 | TR 37.885 Annex A (20 m) |
layout.site_spacing_m |
100 | assumption (dense small cells along the streets; TR 37.885 Table 6.1.3-2 has 500 m macro sites in the urban grid) |
layout.site_offset_m |
9 | assumption (sites on the pavement) |
layout.sites |
7 entries | the ns-3 study (seven sites) |
radio.carrier_ghz |
3.5 | the ns-3 study (3.5 GHz, 10 MHz) |
radio.bandwidth_mhz |
10 | the ns-3 study |
radio.tx_power_dbm |
40 | the ns-3 study (40 dBm) |
radio.bs_gain_db |
0 | the ns-3 study (omnidirectional antennas) |
radio.ue_gain_db |
0 | assumption |
radio.noise_figure_db |
5 | the ns-3 study (5 dB) |
radio.isolation |
1 | no beam isolation (omnidirectional antennas) |
radio.bs_height_m |
10 | TR 38.901 Table 7.4.1-1 (UMi: 10 m) |
radio.ue_height_m |
1.5 | ITU-R M.2412-0 Table 5 (outdoor UEs: 1.5 m), within 1.5-22.5 m of TR 38.901 Table 7.4.1-1 |
radio.pathloss |
umi_street_canyon | TR 38.901 Table 7.4.1-1 |
radio.shadow_los_db |
4 | TR 38.901 Table 7.4.1-1 (UMi and UMa LOS: 4 dB) |
radio.shadow_nlos_db |
7.82 | TR 38.901 Table 7.4.1-1 (UMi NLOS: 7.82 dB) |
radio.shadow_decorr_m |
10 | TR 38.901 Table 7.5-6 Part-1 (UMi: 10 m LOS, 13 m NLOS; the LOS value is used for both, see the limitations) |
radio.place_share |
0 | ns-3 draws shadowing per link: no place-tied part |
radio.clutter_los |
false | the ns-3 study (LOS from the buildings only) |
radio.los_corr_m |
50 | TR 38.901 Table 7.6.3.1-2 (LOS/NLOS state, UMi and UMa: 50 m) |
radio.time_var_db |
0 | not modelled in the ns-3 study |
radio.time_var_tau_s |
1 | assumption |
radio.l1_error_db |
0 | not modelled in the ns-3 study |
radio.penetration_db |
0 | off by default; TR 38.901 clause 7.4.3.2: 9 dB in a standard car |
radio.penetration_sd_db |
0 | off by default; TR 38.901 clause 7.4.3.2: 5 dB in a standard car |
radio.energy_p0_w |
56 | EARTH model, micro base station (Auer et al. 2011, Table 2): 56 W |
radio.energy_slope |
2.6 | EARTH model, micro base station (Auer et al. 2011, Table 2): 2.6 |
radio.map_res_m |
1 | numerical setting |
protocol.step_s |
0.01 | numerical setting |
protocol.l1_period_s |
0.2 | the ns-3 study (one sample every 200 ms) |
protocol.l3_k |
4 | TS 38.331 clause 5.5.3.2 |
protocol.label_period_s |
0.2 | numerical setting |
protocol.report_interval_s |
0.2 | matched to the L1 period |
protocol.qout_db |
-8 | TR 36.839 (Qout -8 dB) |
protocol.qin_db |
-6 | TR 36.839 (Qin -6 dB) |
protocol.qout_window_s |
0.2 | TS 38.133 (evaluation period, 200 ms) |
protocol.qin_window_s |
0.1 | TS 38.133 (evaluation period, 100 ms) |
protocol.n310 |
1 | TR 36.839 |
protocol.n311 |
1 | TR 36.839 |
protocol.t310_s |
1 | TR 36.839 (1 s) |
protocol.prep_s |
0.05 | TR 36.839 (50 ms) |
protocol.exec_s |
0.01 | the ns-3 study |
protocol.reest_s |
1 | assumption (1 s outage); TS 38.133 6.2.1.2.1 bounds the delay by 50 ms + cell identification (FR1: 200 ms known, 800 ms unknown cell, Table 6.2.1.2.1-1) + system information + PRACH; TR 36.842 Table E.1-2 uses 250 ms |
protocol.cho_recovery_s |
0.4 | TS 38.300 clauses 9.2.3.1 and 9.2.7 (recovery into a CHO candidate; assumption 0.4 s) |
protocol.pingpong_s |
1 | TR 36.839 (minimum time of stay, 1 s) |
protocol.cfg_loss_as_failure |
false | check mode only |
protocol.lm_load |
none | off by default: link monitoring sees the load of the data channel (calibration option) |
protocol.lm_load_per_ue |
0 | off by default (calibration option) |
protocol.exec_can_fail |
true | TR 36.839: the execution fails when the target is below Qout |
protocol.rlm_holdoff_s |
0.2 | 0.2 s since 2.0.0: an interpretation of TS 38.133 8.1.2.2 (evaluation over the last T_Evaluate_out, 200 ms in FR1) on a newly joined cell |
traffic.services |
5 entries | TS 23.501 Table 5.7.4-1 (5QI); thresholds are assumptions |
traffic.se_max |
7.4 | assumption (spectral-efficiency cap) |
traffic.hotspot_share |
0 | assumption |
traffic.hotspot_load |
[0.03, 0.03] | assumption (as normal_load) |
traffic.normal_load |
[0.03, 0.03] | assumption: light traffic of 10 packets/s per user, about 3 % load |
traffic.load_tau_s |
0.2 | assumption |
traffic.rate_scale |
0.001 | light traffic |
traffic.label_load |
1 | assumption (all cells transmit for the label) |
traffic.model |
fixed | fixed: constant service rates (the model of 1.0) |
traffic.period_s |
0.02 | periodic model: 20 ms, as VoIP |
traffic.packet_bytes |
100 | periodic model: assumption |
traffic.ftp_file_bytes |
500000 | FTP model 3 (TR 36.872 Annex A.1) with 0.5 Mbyte files (TR 38.802 Table A.2.1-1; TR 38.821 Table 6.1.1.1-7) |
traffic.ftp_rate_hz |
0.1 | ftp3 model: assumption (file arrival rate per user) |
mobility.users |
20 | assumption |
mobility.profile |
c16 | the ns-3 study (constant speed on the centre lines; c8, c16 and c30 are compared) |
mobility.groups |
none | profile |
run.duration_s |
150 | the ns-3 study (150 s, the first 60 s not counted) |
run.warmup_s |
60 | numerical setting |
Not read by this layout and radio model, so not listed: radio.shadow_site_corr.
Known limitations
- Seeds are different realisations in the two simulators; only averages over settings and conditions can be compared.
- The interfering load is defined differently in the two simulators, so failure rates are reported without a pass limit.
- Only baseline handover can be compared: 5G-LENA has no conditional handover.
- The shadowing along each user's path has one decorrelation distance, the UMi LOS value of 10 m, also on NLOS links (TR 38.901 Table 7.5-6 Part-1: NLOS 13 m).
Reference results
- ns-3 / 5G-LENA results for 24 Event-A3 settings on four conditions (site distance 200 / 400 m, 16 / 30 m/s), stored in handoverlab/verify/data/ns3_urban_a3.json; acceptance limits: median ratio of handover and of unnecessary-handover rates in [0.8, 1.25], rank correlation over the settings at least 0.9 (
handoverlab verify --ns3). - Result of version 0.2.0a1 (one seed per condition): median ratio HandoverLab / ns-3 of 0.95 for the handover rate and 1.04 for the unnecessary-handover rate, rank correlation 0.99 for both; failure rate 0.13 against 0.43 per UE-minute (rank correlation 0.54), mean serving SINR 26.2 dB against 11.5 dB.